
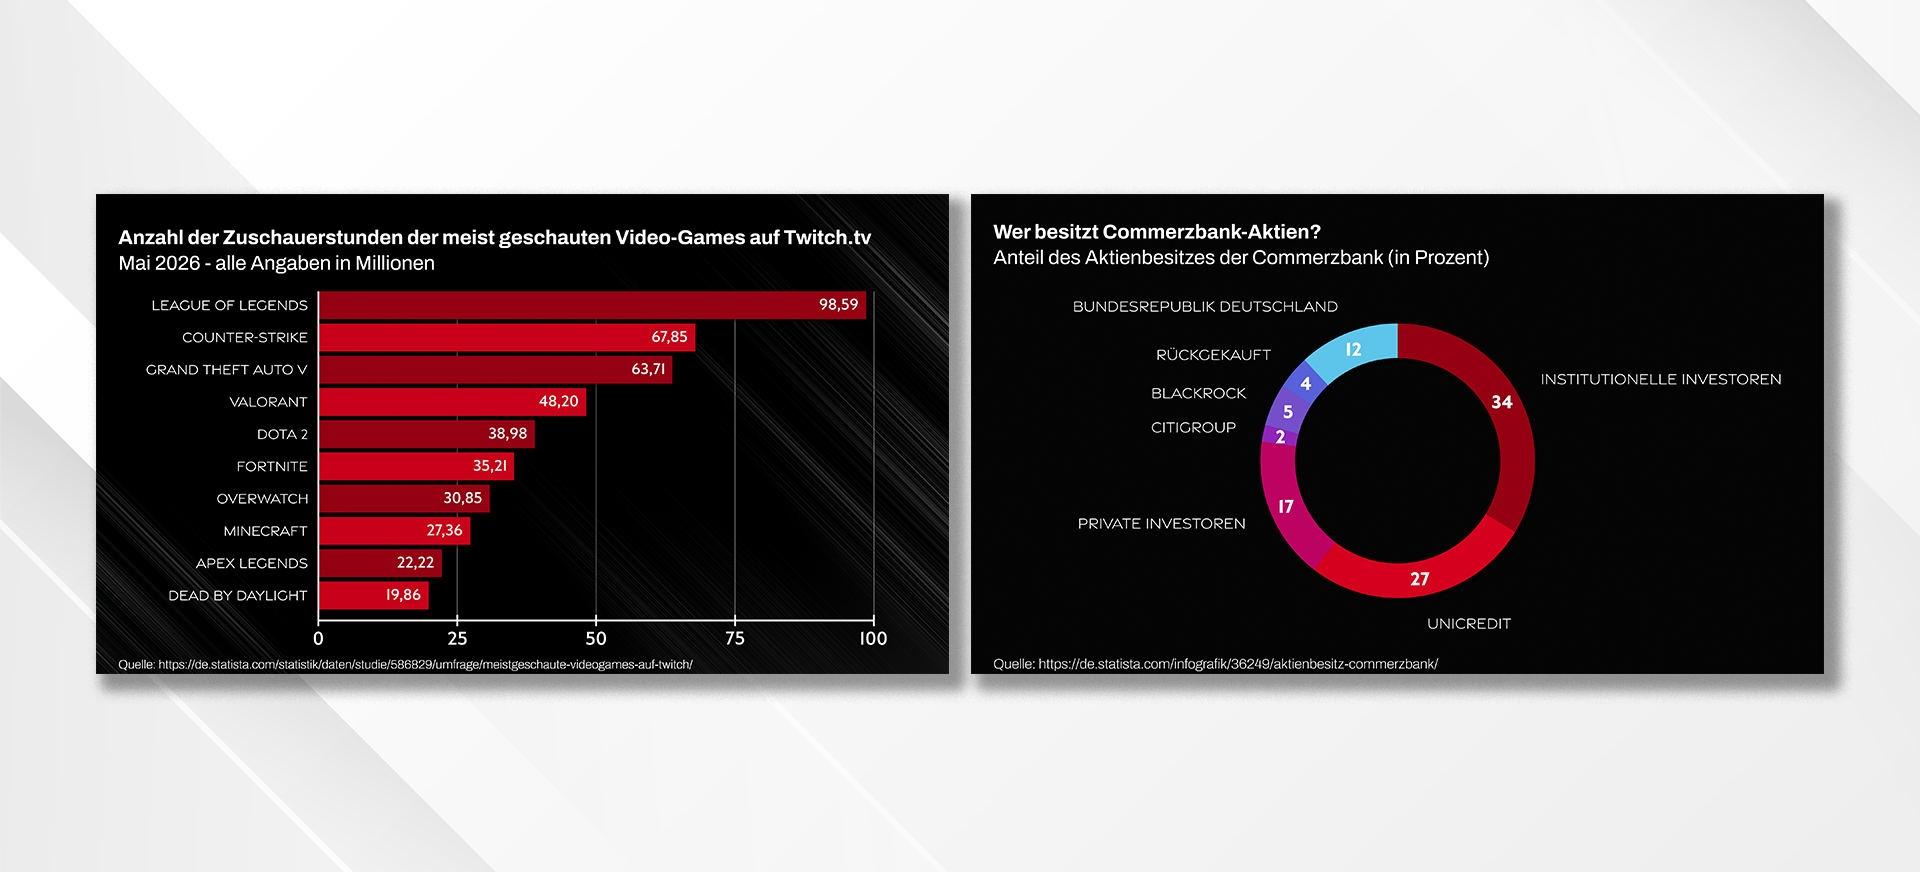
Statistics & Chart Templates for Premiere Pro
Turn numbers, statistics, and comparisons into clear, professional animations with customizable Statistics and Chart Templates for Adobe Premiere Pro.
Our Motion Graphics Templates (MOGRTs) are built for editors who want to visualize statistics without building complex animations from scratch in After Effects. Adjust values, labels, colors, titles, sources, and layouts directly in Premiere Pro to create graphics that match your content and visual identity.
Animated Statistics Templates Made for Video Editors
Statistics can be hard to communicate through static tables or plain text. Animated chart templates help viewers understand comparisons, trends, proportions, and key figures faster.
Our Statistics and Data Templates combine clear visual design with flexible controls, making them suitable for explainer videos, YouTube content, reports, presentations, documentaries, social media, sports coverage, and branded corporate videos.
Each template is built to make statistics-driven graphics easier to create, while giving you full control over the design.
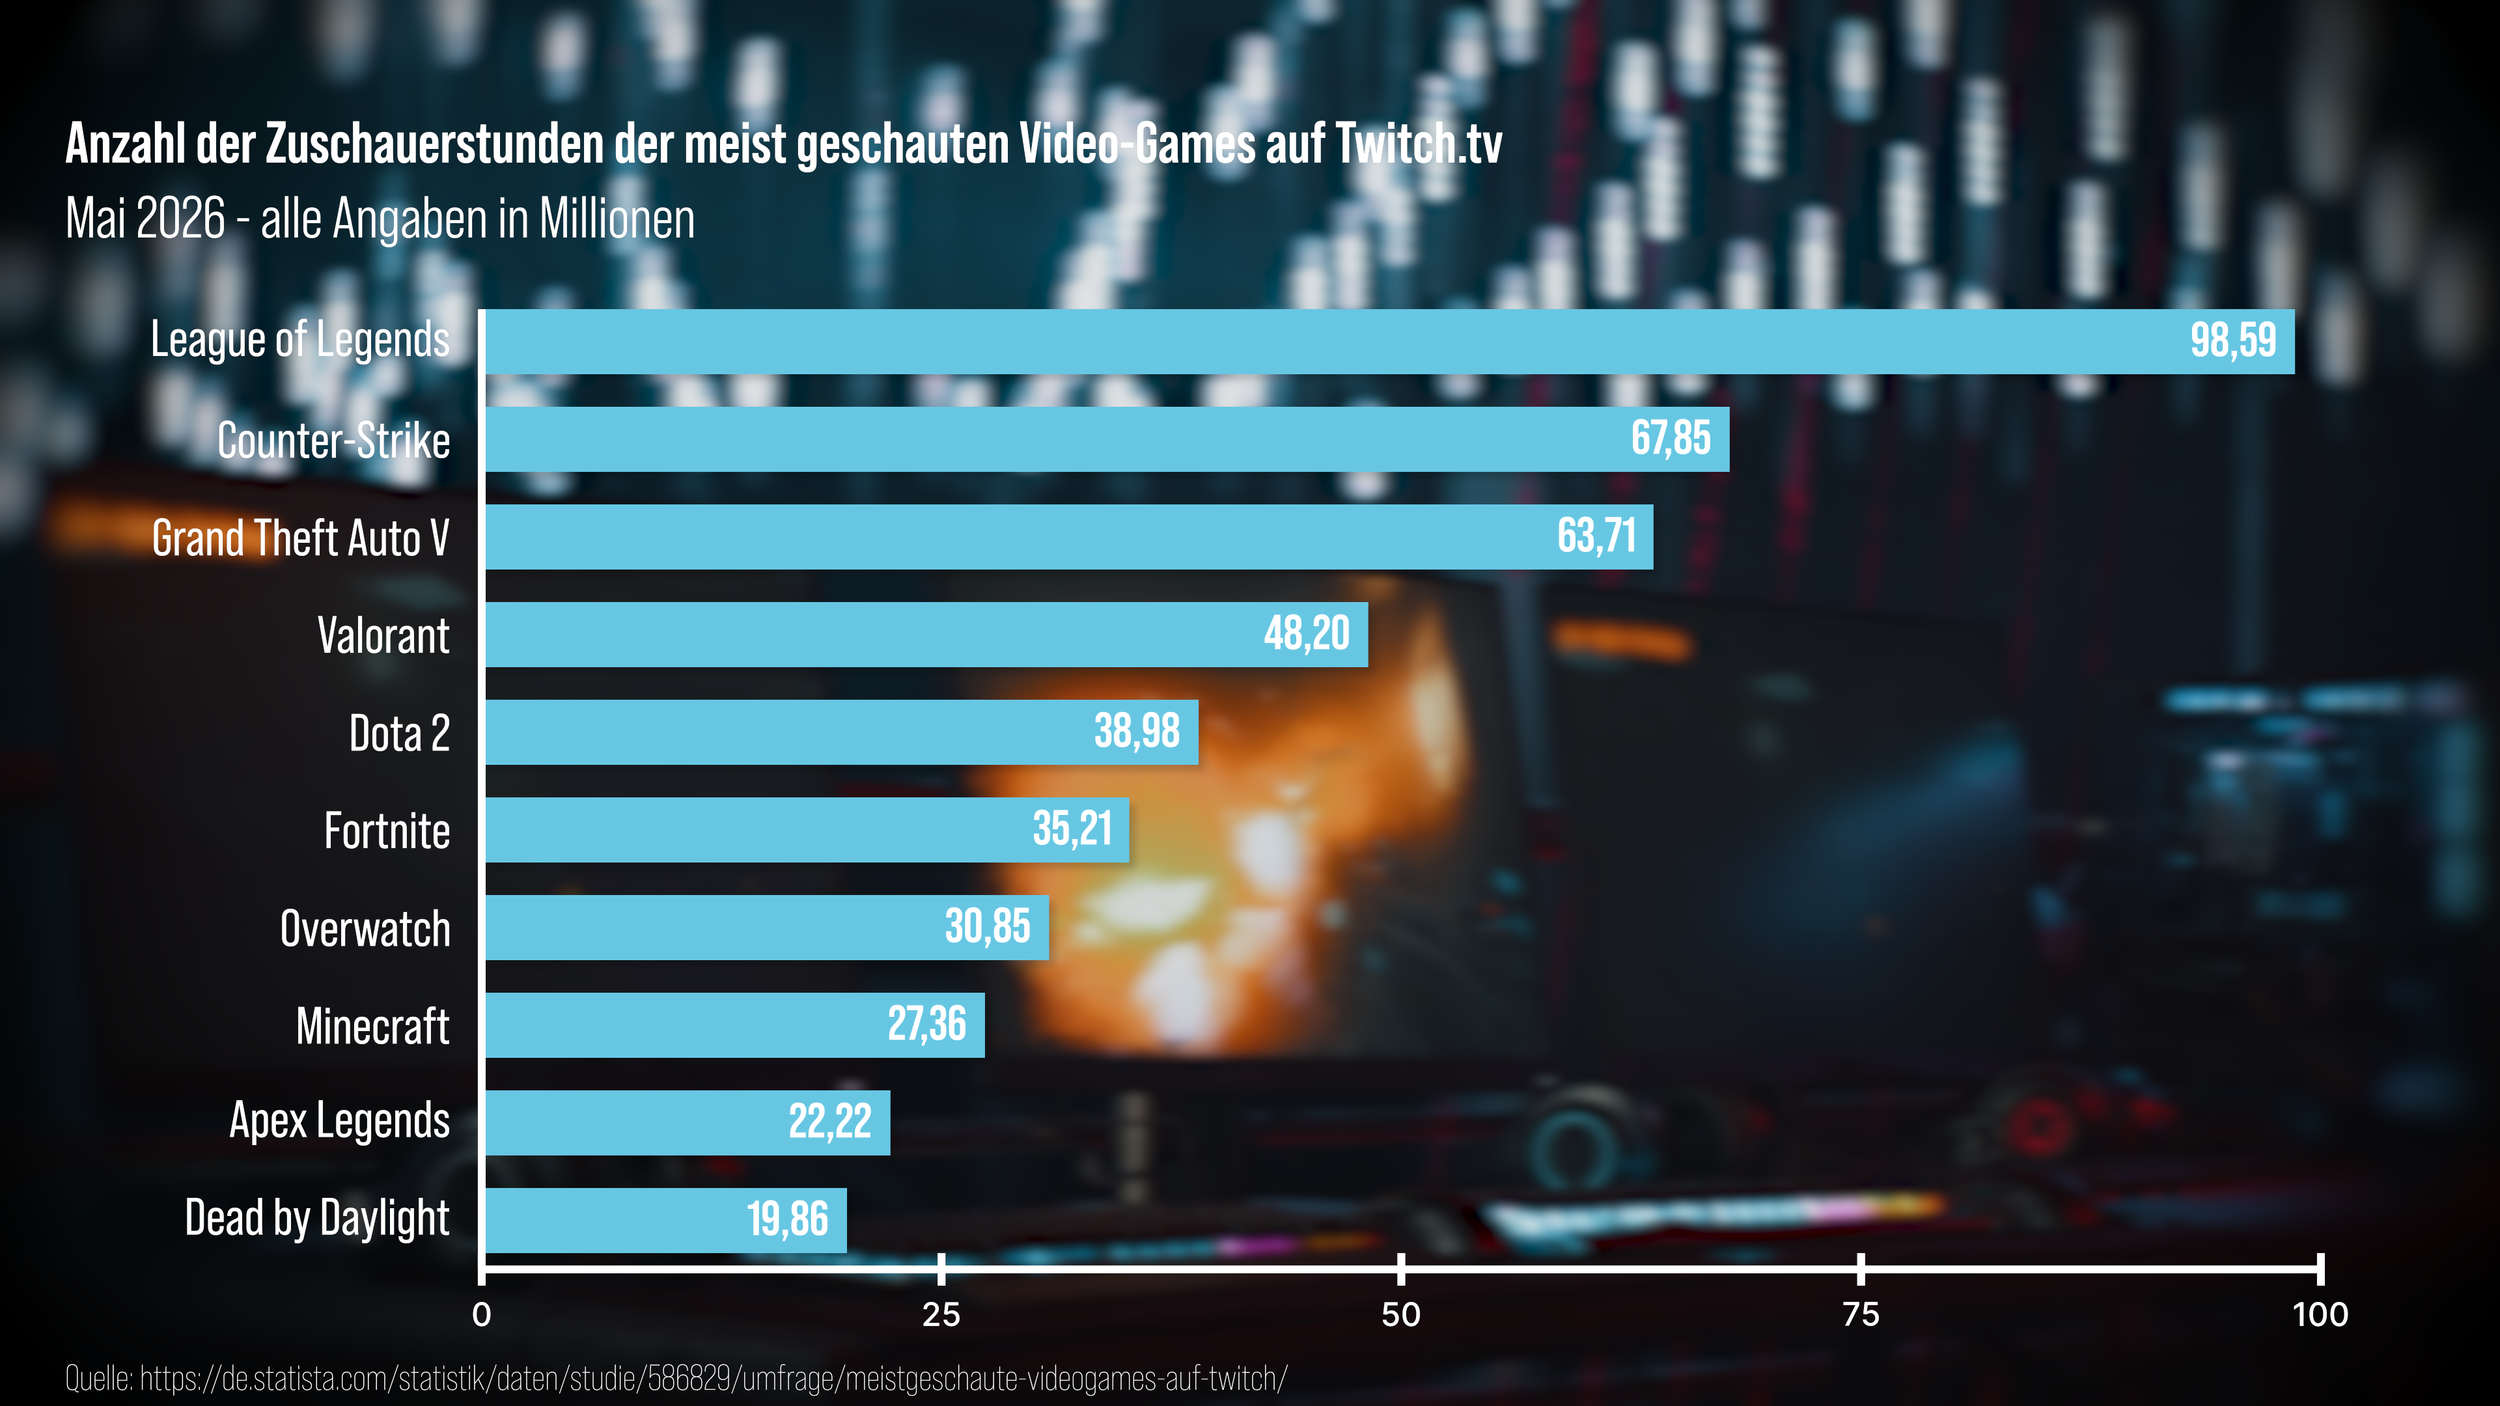
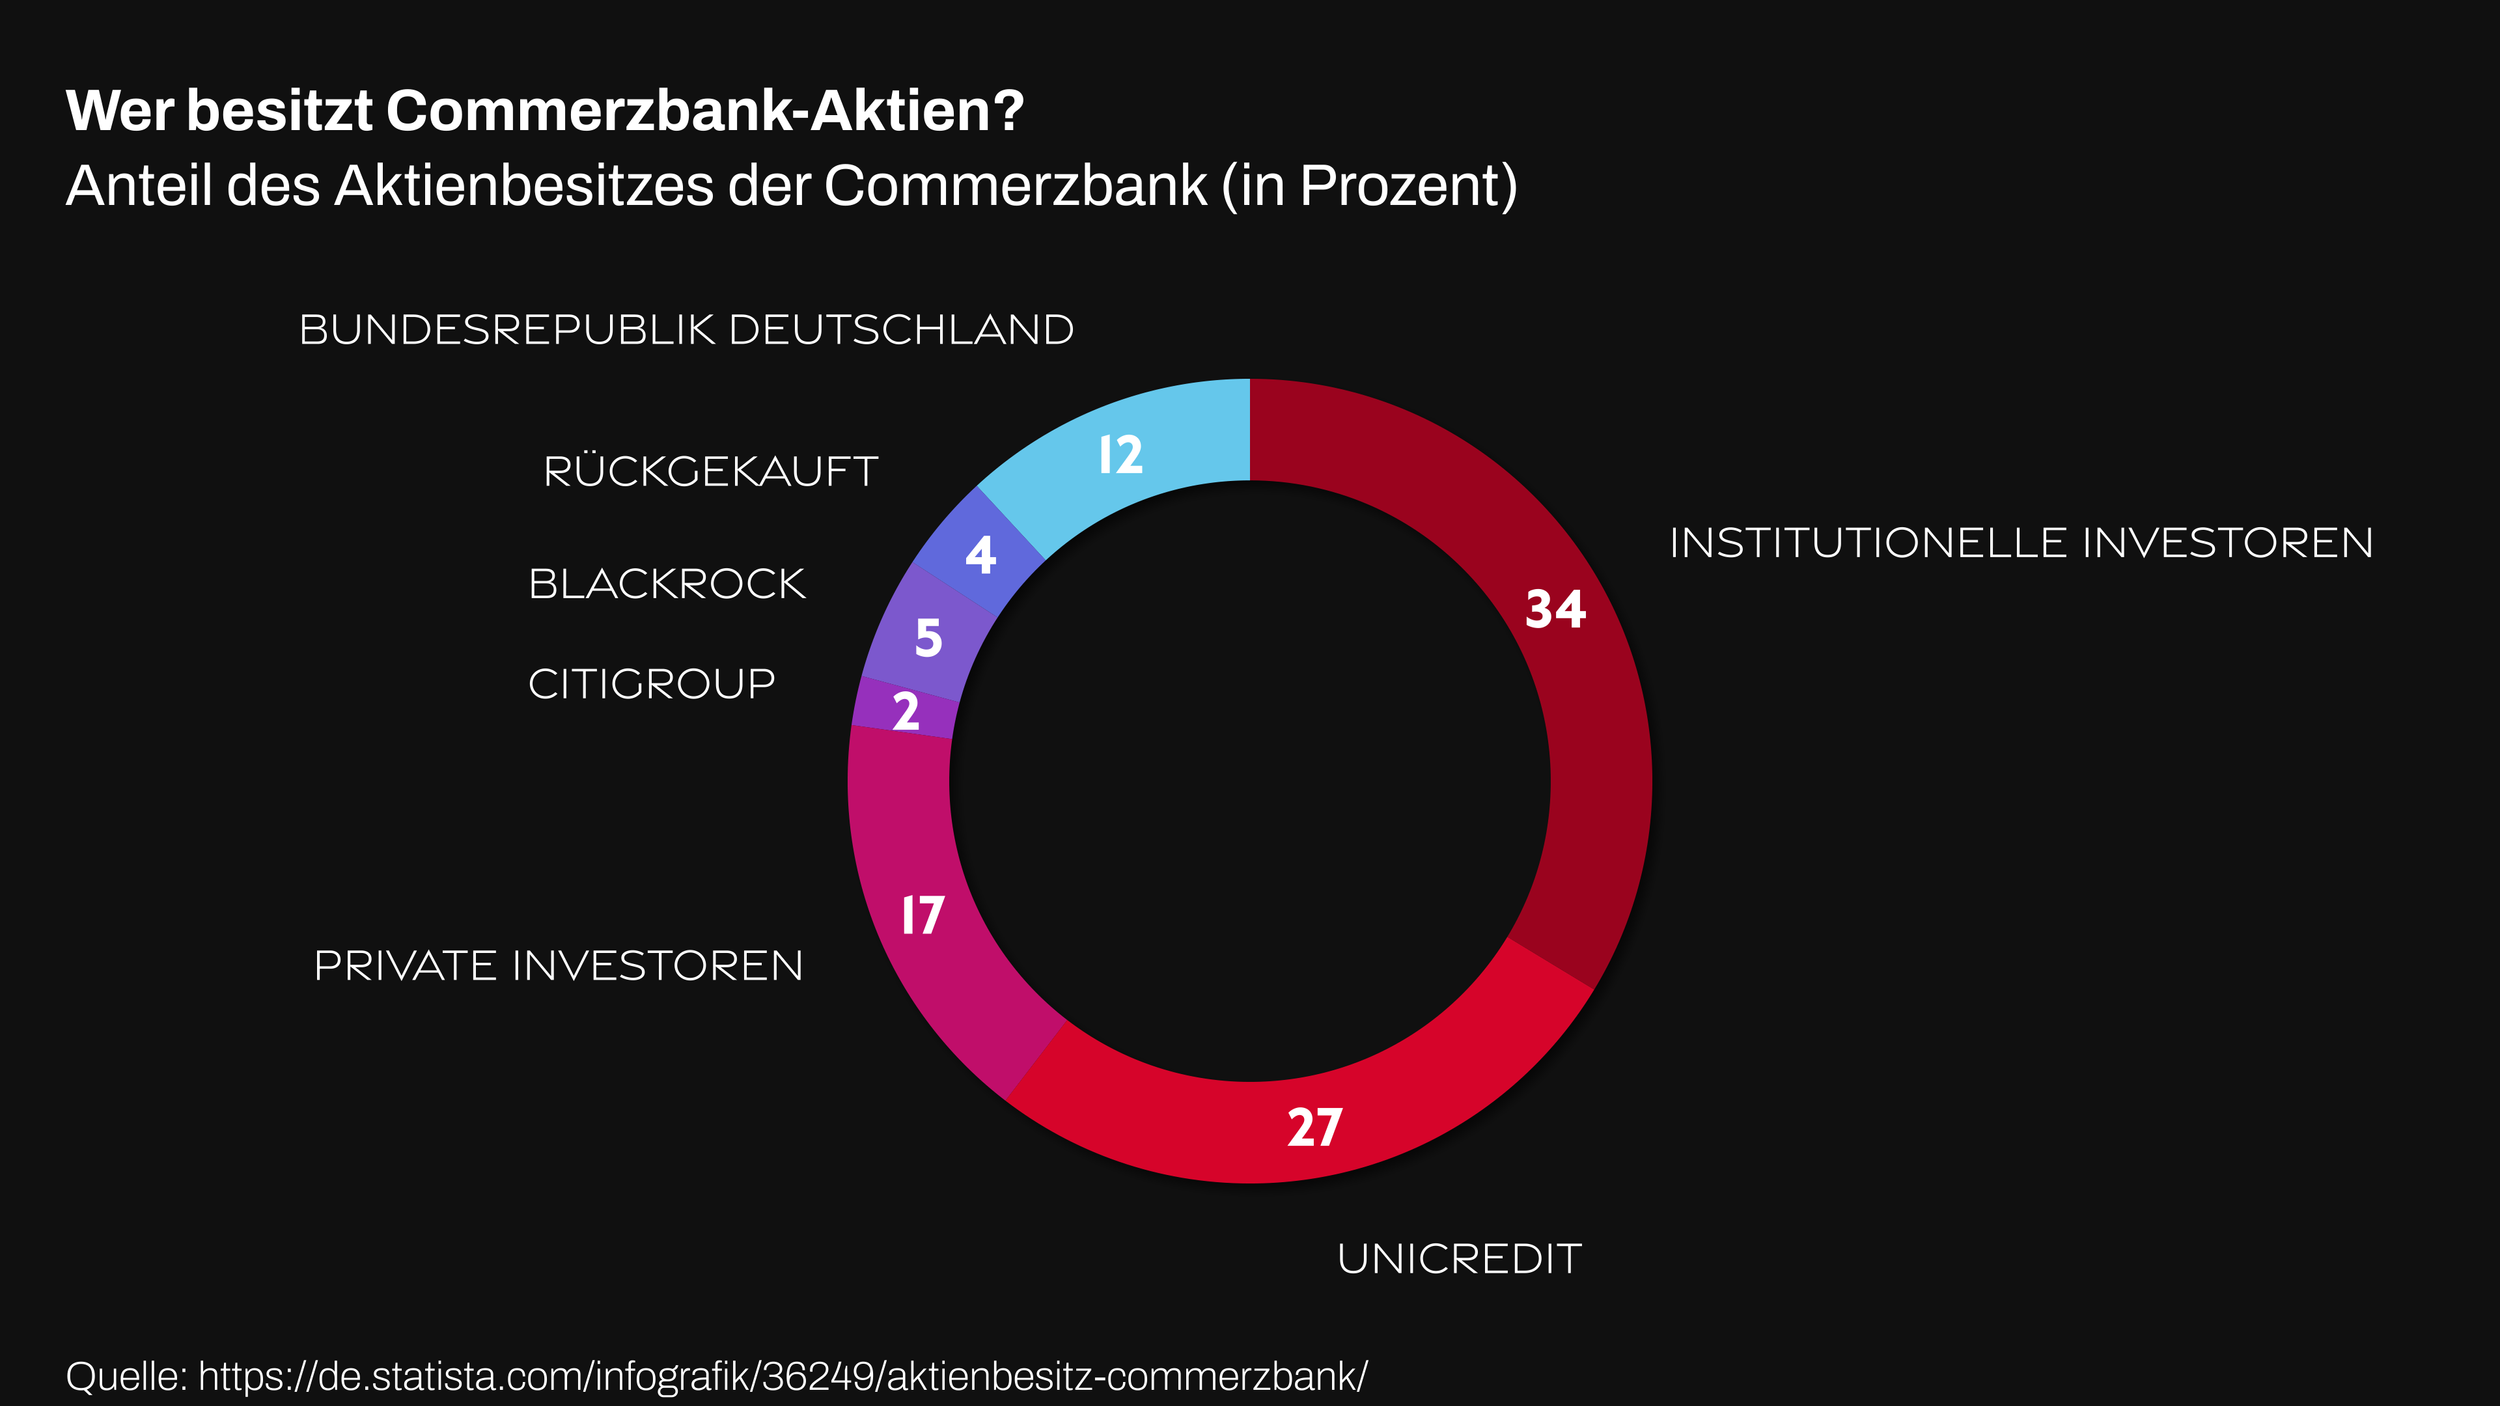
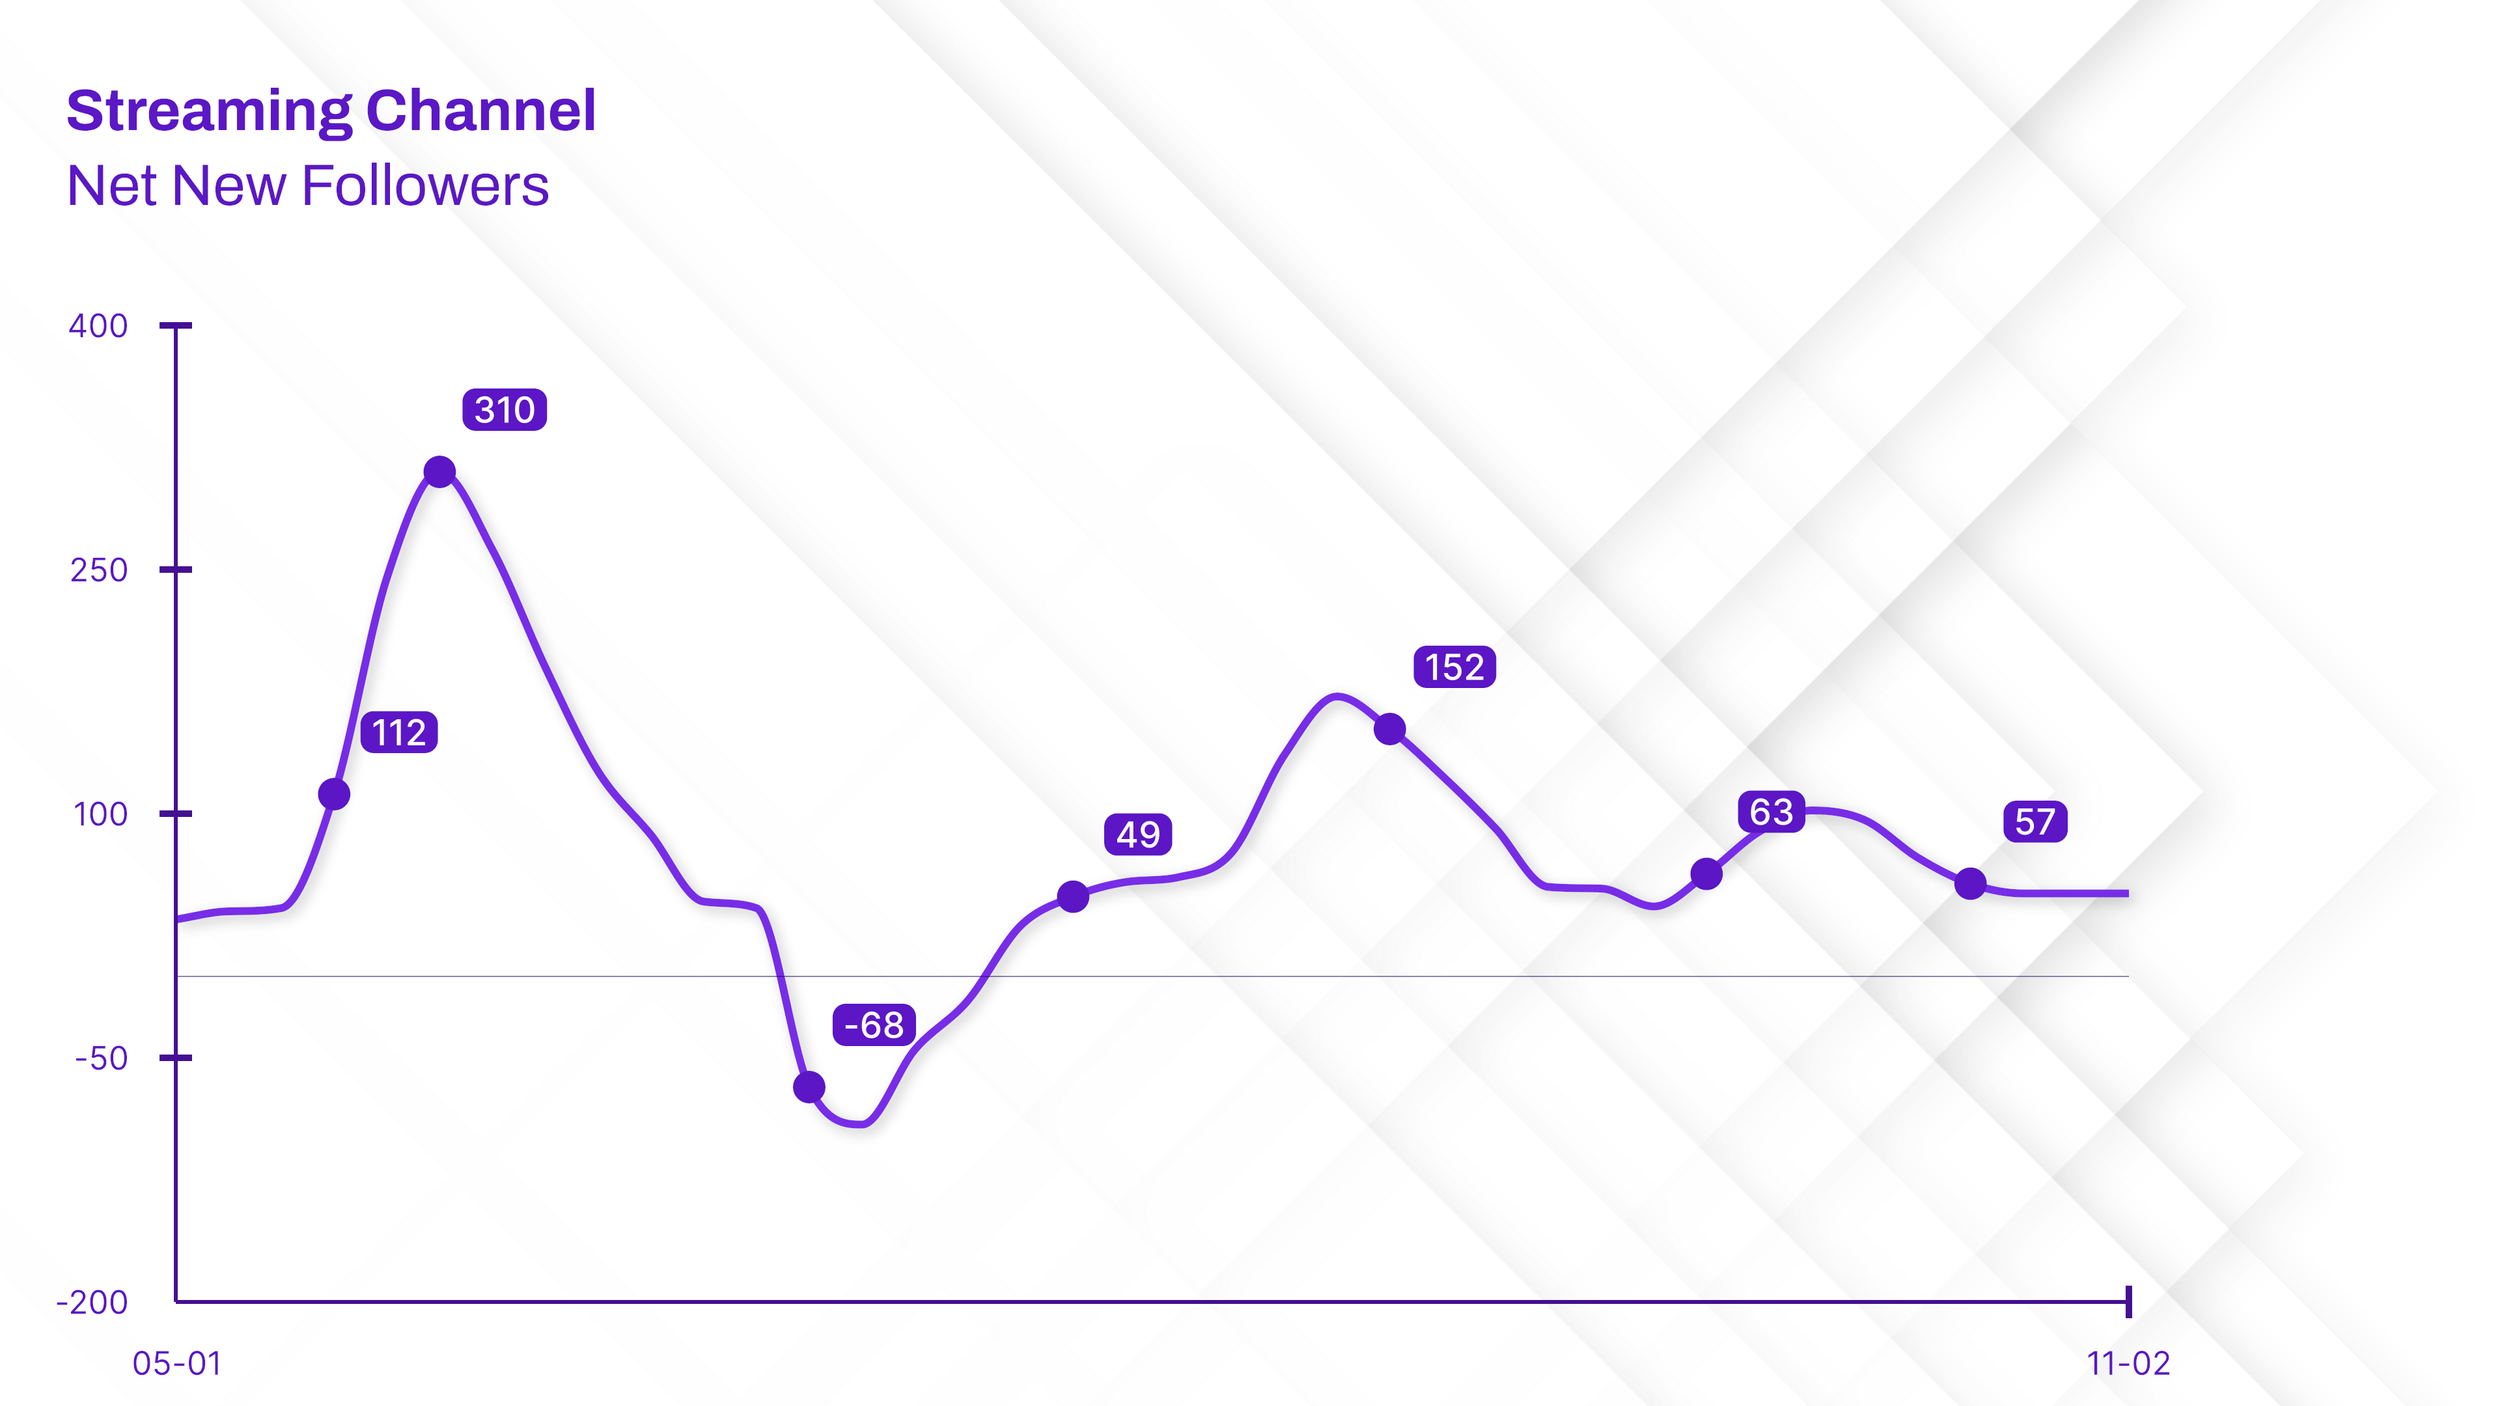
Designed to Match Your Visual Identity
Every video project has its own design requirements. That is why our chart templates are built with flexible styling options instead of one fixed appearance.
Colors, typography, spacing, dimensions, labels, titles, sources, and other visual elements can be adjusted to match your brand or corporate design.
This allows the same MOGRT to be reused across different clients, video formats, campaigns, and content series.
Whether you need a minimal chart for a business presentation or a bold graphic for social media, the templates can be adapted without rebuilding the animation.
Customize Charts Directly in Premiere Pro
The most important controls are available through Premiere Pro’s Properties panel, allowing you to customize the graphic while editing your video.
Depending on the selected MOGRT, you can adjust elements such as:
Data values and labels
Chart colors
Titles, subtitles, and sources
Bar, line, or segment appearance
Axes, ticks, and guides
Text positioning and spacing
Chart dimensions and layout
Animation and display options
No additional Premiere Pro plugin is required.
Built for Different Video Formats
The downloadable packages include easily adaptable controls for common video layouts. This makes it easier to use the same visual style across YouTube videos, presentations, Instagram Reels, TikTok, YouTube Shorts, and other social platforms.
CSV-Supported Data Workflows
Selected Chart and Data MOGRTs include support for CSV files. This allows values and labels to be prepared in a spreadsheet and imported into Premiere Pro as a structured data source.
An example CSV file is included with compatible products, helping you understand the required format and replace the sample data with your own information.
CSV support is particularly useful for charts containing several data points, recurring reports, rankings, statistics, and projects that need frequent updates.
Suitable for a Wide Range of Projects
Chart MOGRTs can be used wherever numbers need to be presented clearly and professionally, including:
Explainer videos
YouTube videos
Business presentations
Corporate communications
Financial and performance reports
News and documentary content
Educational videos
Sports statistics
Social media content
Product comparisons
Surveys and research results
Data-driven storytelling
What Is Included?
The exact contents vary by product, but each download clearly lists all included files and supported features.
A typical Chart MOGRT package may include:
The MOGRT
Example data or CSV files
a EULA
After purchasing through Gumroad, the files can be downloaded and installed in Premiere Pro.
Need a custom MOGRT for your projects?
Simply fill out the form with a few details about your requirements. Let us know what type of template you need, which features are important, and how the MOGRT will be used. We’ll review your request and get back to you as soon as possible with an initial assessment of implementation, scope, and workflow.