
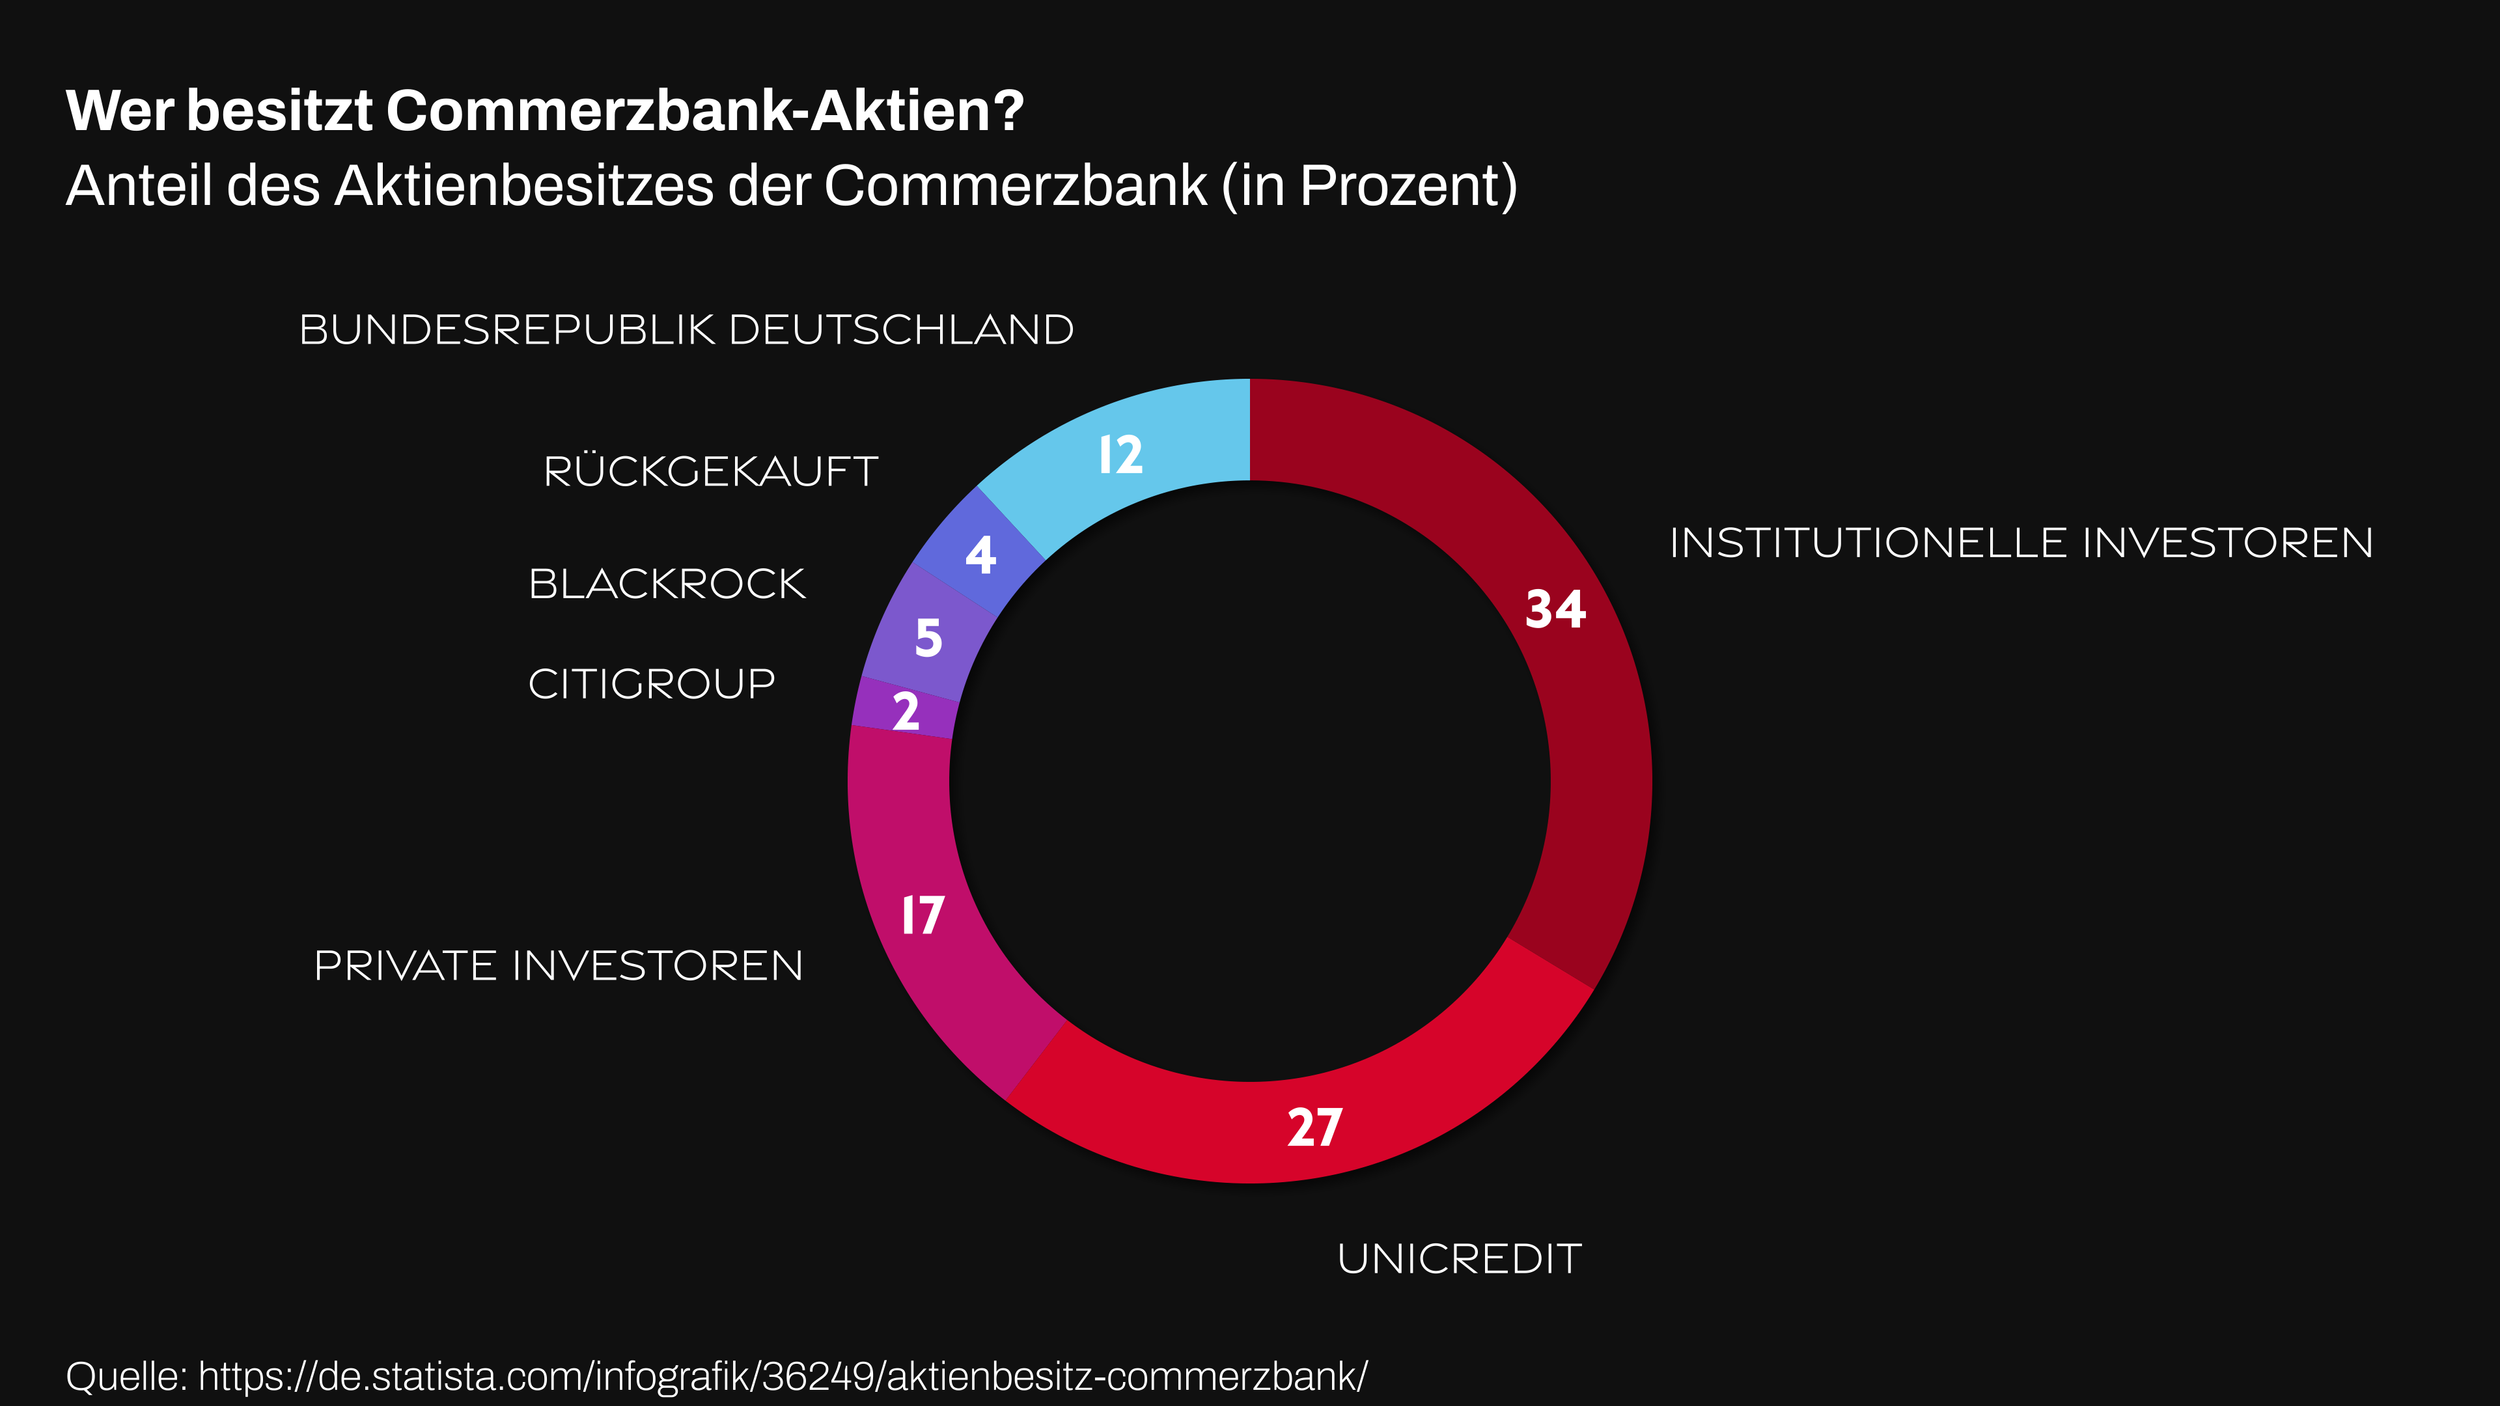
Animated Donut Chart MOGRT for Premiere Pro
This animated donut chart Motion Graphics Template (MOGRT) lets you turn raw spreadsheet data into a polished, fully animated donut chart - directly inside Premiere Pro's Essential Graphics panel. No keyframing, no scripting, no plugins. Just enter your labels and values, adjust the controls, and render a broadcast-ready animated donut chart in minutes.
Built for marketers, analysts, YouTubers, and motion designers who need clean, customizable data visualization templates for showing breakdowns, percentages, and proportional data without opening After Effects.
Key Features
Spreadsheet-driven data input
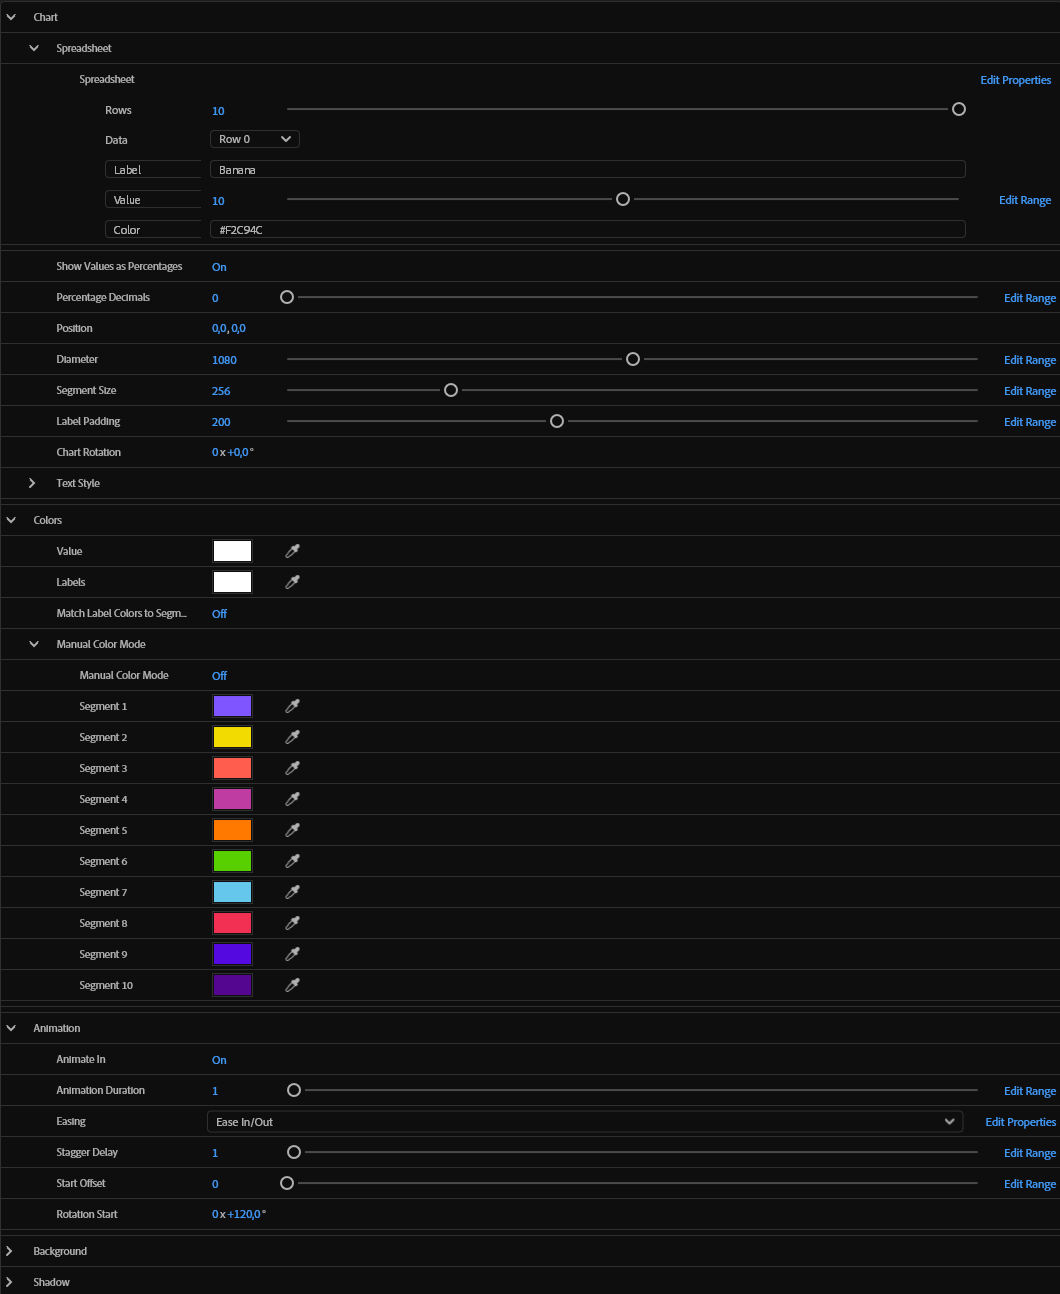
edit labels, values, and per-segment colors row by row
Automatic percentage calculation
with adjustable decimal precision
Full animation control
with adjustable duration, easing, stagger delay, and start offset
Custom chart and animation rotation
for creative spin-in effects
Flexible color system
manual per-segment color assignment (up to 10 segments), or csv-matched colors
Adjustable diameter, segment thickness, and label padding
Dedicated text style controls
for labels and values
Editable background and shadow layers
No plugins required
works natively in Premiere Pro's Essential Graphics panel
available Controls
Download
Your download includes three ready-to-use MOGRT versions for landscape, square, and vertical projects, plus an example CSV file to help you get started quickly.
Purchase the template securely through Gumroad and receive immediate access to all included files.